Observability for AIAgents: Why Monitoring Matters in RAG and Agentic Systems
In our ongoing exploration of AI-powered IT transformation, we’ve discussed how AIOps empowers teams to move from reactive firefighting to proactive, automated operations. But for AIOps to function—especially in dynamic environments powered by agentic workflows and Retrieval-Augmented Generation (RAG)—there must be complete visibility into what’s happening inside the system. That’s where observability comes in.
Observability isn’t just a supporting capability; it’s the foundation. It captures the signals - logs, metrics, traces—that make intelligent operations possible. Without it, AI agents become opaque, failures go undiagnosed, and automation becomes risky.
This blog dives into why observability is essential for AI agents and RAG pipelines, how to implement it effectively, and what to look for in your tooling stack. We’ll also show how observability feeds directly into AIOps, enabling real-time insights, faster resolution, and smarter automation at scale.
What is Observability?
Observability is the ability to understand a system's internal state based on the external outputs it produces. In practice, it means collecting and correlating telemetry data—like logs, metrics, and traces—to answer critical questions about system behavior, performance, and failures.
For AI agents, observability helps teams:
- Trace how decisions were made
- Debug failures and bottlenecks
- Monitor for hallucinations or degraded performance
- Ensure consistent output quality and reliability
This blog explores why observability is essential for AI agents—especially those using Retrieval-Augmented Generation (RAG)—and multi-agent systems. Each architecture introduces its own complexity, but RAG systems in particular come with challenges that make observability mission-critical. We’ll break down the risks of skipping observability, walk through implementation patterns, and give you a clear checklist to production-proof your agent workflows.
Why Observability Is Non-Negotiable for AI Agents and RAG Systems
AI agents are different from traditional applications. They're:
- Non-deterministic – They don’t produce the same result twice for the same input.
- Multi-modal and asynchronous – They often handle API calls, web searches, document retrieval, and memory updates in a single flow.
- Task-delegating – In agentic architectures, one agent may delegate work to others or rely on dynamic tools.
This complexity creates a black-box risk. If you can’t trace what happened, when, and why, it’s impossible to debug, improve, or trust the system.
RAG pipelines amplify this challenge. Each query may:
- Trigger a vector search across external knowledge bases
- Retrieve a changing set of documents based on embeddings
- Dynamically blend retrieved content with prompts to generate responses
Without observability, you won’t know whether poor results came from bad retrieval, embedding mismatches, or flawed prompt construction. Monitoring the full chain—from user intent to document selection to final output—is essential for quality assurance and trust.
Risks Without Observability:
- Untraceable hallucinations or toxic responses
- Retrieval failures (e.g., RAG queries returning irrelevant docs)
- Latency spikes during tool invocation
- Failure loops in agent-agent communication
- Poor performance attribution across components (model, tool, context, API)
The 3 Core Pillars of Observability for AI Agents
Just like modern DevOps, observability for AI agents depends on three foundational signals:
- Traces – End-to-end visibility
- Capture each step the agent takes: planning, tool usage, sub-agent calls, and final output
- Identify long latencies or infinite loops in reasoning
- Tools: LangSmith, Traceloop, OpenTelemetry, Prometheus (tracing extensions)
- Logs – Step-by-step reasoning
- Log prompt inputs, tool outputs, API responses, memory updates, and final decisions
- Capture reasoning chains and tool call justifications
- Tools: LLMonitor, LangChain Debug, Weights & Biases LLM Logs
- Metrics – Aggregate performance data
- Success/failure rates of tool usage, token consumption, context window overflows
- Frequency of hallucinations, retrieval misses, or task drops
- Tools: Arize AI, WhyLabs, Evidently AI, Datadog with LLM extensions
Key Use Cases: What Observability Helps You Detect
| Use Case | Risk Without Observability | Metric or Signal to Track |
|---|---|---|
| RAG Retrieval Failures | Poor or irrelevant context | Document match score, fallback rates |
| Multi-Agent Hand-off Errors | Workflow breaks or missing context | Trace depth, context propagation metrics |
| Hallucination Risk | Unsafe or ungrounded outputs | Input/output token overlap, vector match accuracy |
| Latency in Tool Invocation | Slow or failing agents | Tool call duration, timeout rates |
| Output Quality Drift | Model degradation or changing behavior | Output embeddings, user feedback loop |
Tools Spotlight: Observability Platforms for RAG and Agentic Systems
When building observability into AI agent workflows, your tooling needs to go beyond traditional infrastructure monitoring. Below are some of the most relevant platforms tailored for multi-agent orchestration, RAG pipelines, and large language model workflows:
Agentic & LLM Observability
LangSmith
LangSmith is a unified observability and evaluation platform designed for debugging, testing, and monitoring AI agent workflows. It supports both LangChain-based and custom orchestration environments.
Traceloop
Traceloop provides observability for LLM applications by transforming user interactions and annotations into structured trace data. It integrates deeply with OpenLLMetry and is ideal for tracking behavior in real-time and production environments.
LLMonitor
LLMonitor is an open-source tool focused on early-stage LLM development. It offers lightweight logging, prompt tracing, usage analytics, and evaluation features that help teams iterate faster during prototyping.
Weights & Biases (W&B)
Weights & Biases offers LLM-specific tracking and experiment logging with integrations for LangChain and OpenAI. It’s designed for teams running model experiments and needing detailed audit trails and visualizations.
- Learn how to integrate W&B with LangChain
- Read the getting started guide for W&B and LangChain
AI/ML Performance Monitoring
Arize AI
Arize enables model performance monitoring in real-time by tracking feature quality, drift, and embedding stability across deployments.
WhyLabs
WhyLabs focuses on production-grade AI observability, offering tools to monitor data quality, prompt performance, and detect anomalies across complex AI pipelines.
Evidently AI
Evidently AI offers customizable dashboards for monitoring data drift, model performance, and prompt-response consistency across environments.
Core Telemetry Infrastructure
OpenTelemetry
OpenTelemetry is a vendor-neutral, open-source standard for collecting telemetry data such as logs, traces, and metrics. It’s foundational for observability across distributed, multi-agent systems.
Prometheus + Grafana
Prometheus collects time-series metrics, while Grafana provides visualization layers for deep operational insights. Together, they form a powerful monitoring solution for real-time telemetry and alerting.
Datadog
Datadog is a full-stack observability platform with native support for LLM pipelines, chain tracing, and infrastructure monitoring across hybrid environments.
Chronosphere
Cloud-native observability platform that reduces data volumes by 60%, controls costs, boosts reliability, accelerates troubleshooting, and seamlessly integrates open-source tools like Prometheus and OpenTelemetry
- Explore Chronosphere
- Chronosphere’s blog is a goldmine for scaling your observability game. Get actionable insights on metrics, tracing, and logs, master integrations like Prometheus and OTel, and learn the tricks of platform engineering and guided troubleshooting (DDx)—all from a team that's lived the cloud-native journey.
What Observability Looks Like in AI Agent & RAG Systems
1. A Full Trace of an Agent’s Journey
Think: a visual graph or timeline showing:
- Prompt received
- Document retrieval step (with top-5 documents, sources, scores)
- Agent plan → Tool #1 used → Output logged
- Tool #2 called → Another sub-agent invoked
- Final answer returned
LangSmith or Traceloop show this as a graph/tree structure with node-level data.
2. A Stream of Logs with Context
You’ll see a real-time log like:
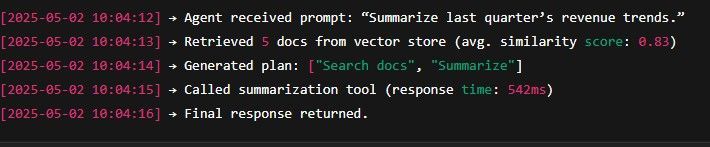
These logs are structured and timestamped — not just print statements.
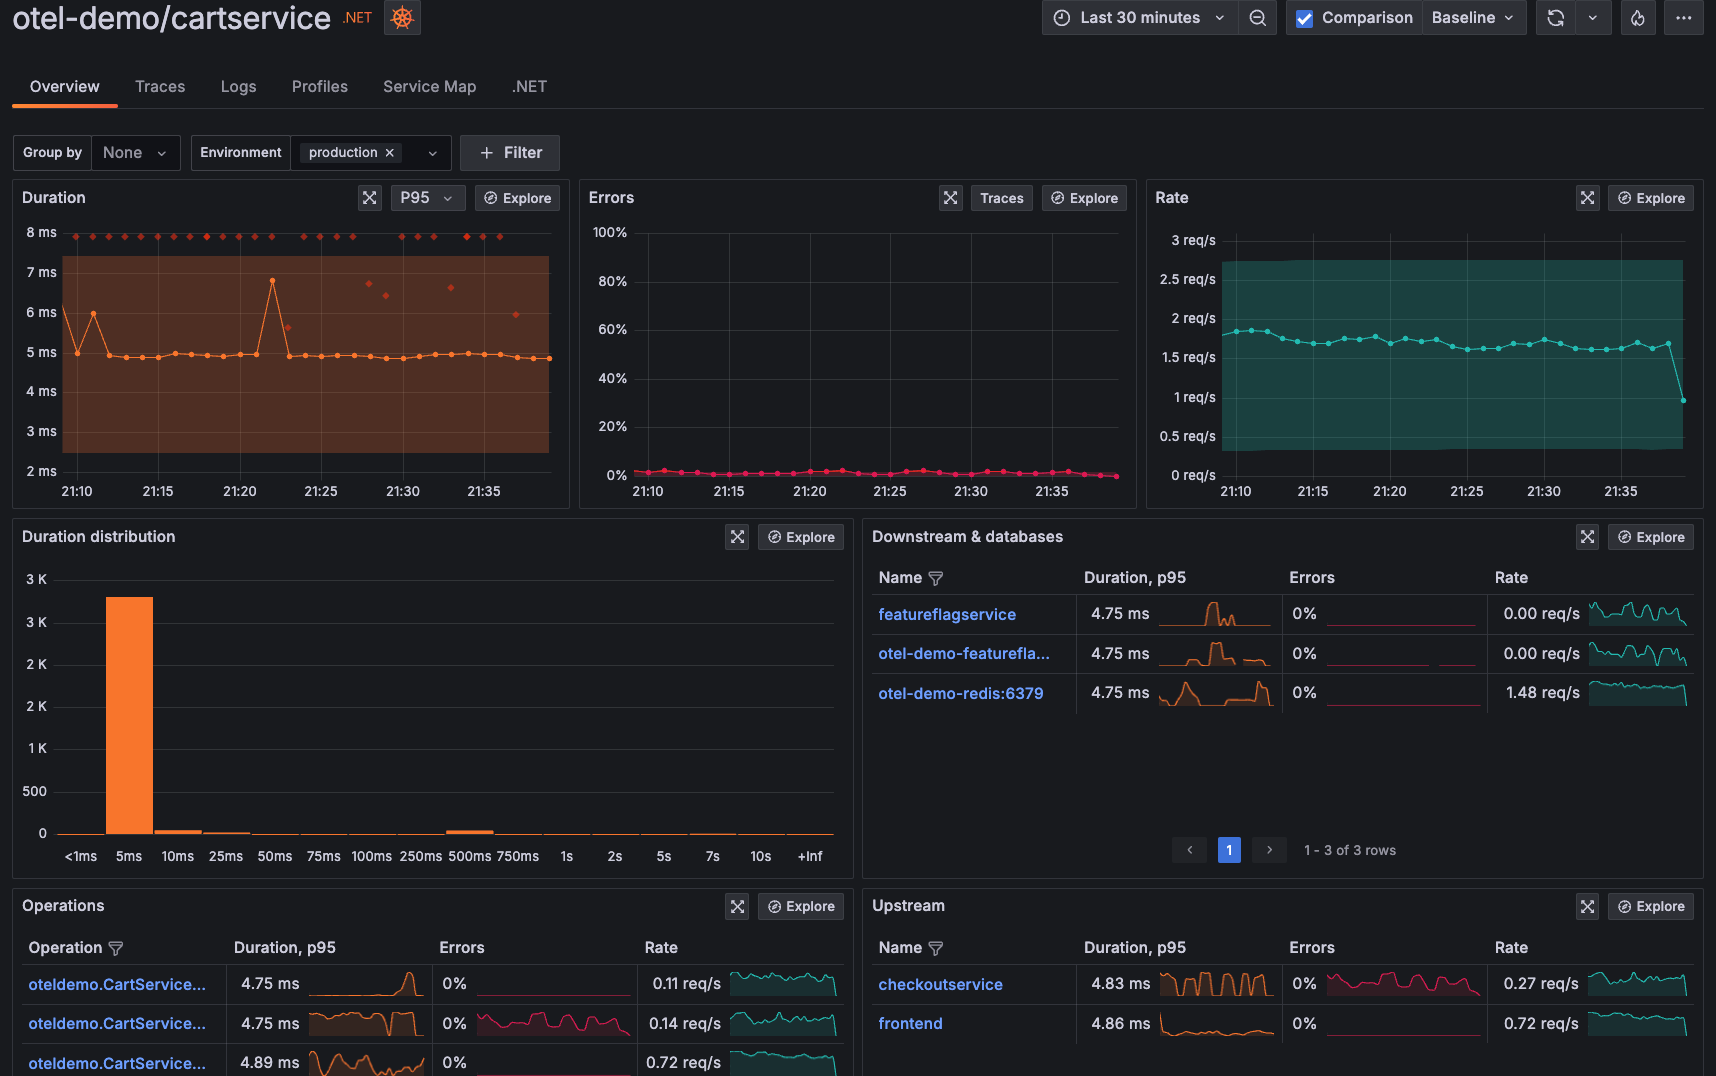
3. Dashboards and Metrics Panels
Dashboards show:
- Latency per tool call (e.g., Tool A: 500ms avg, Tool B: 3s spike)
- Success/failure rate of retrieval steps
- Context window usage (how full is the token space)
- Token cost per run
- Output drift over time (via embedding similarity)
Tools like Arize AI, Grafana, or WhyLabs give visual charts and anomaly detection across agents.
Example demo sample of Grafana's Application Observability Dashboard showing service latency, error rate and request throughput over time:
4. Alerts and Anomaly Flags
You’ll get automated alerts like:
- “Retrieval score dropped below 0.7 for 5+ queries in the past hour”
- “Summarizer tool failed 3 times in last 10 minutes”
- “User feedback rating dropped below 3.5/5 in past 24 hours”
This is how you catch:
- Silent failures
- Tool degradation
- Bad user experience
5. Retrieval Debug Panels (For RAG)
- See which documents were retrieved
- View match scores (0.95, 0.87, 0.56…)
- Identify when retrieval returned unrelated info
- Track fallback behavior when retrieval fails
TL;DR: Observability looks like a combination of:
- Trace graphs
- Live structured logs
- Dashboards of key metrics
- Searchable telemetry
- Auto-alerting on anomalies
How Observability Integrates with AIOps
In our previous blogs, we explored how AIOps elevates IT operations through automation, prediction, and intelligent decision-making. But what fuels that intelligence? Observability. We want to highlight the crucial role observability plays as the data foundation for AIOps. Without rich, structured telemetry—logs, traces, and metrics—AIOps systems can’t detect anomalies, correlate incidents, or automate responses. Observability gives visibility into what’s happening; AIOps determines what to do next. When applied to AI agents and RAG pipelines, this integration enables proactive monitoring, faster resolution, and trust in automation at scale.
1. Observability = The Raw Material of AIOps
Observability generates the logs, metrics, and traces that AIOps platforms need to:
- Detect anomalies
- Correlate events
- Trigger predictions
- Recommend or execute automated actions
Without good observability, your AIOps engine is flying blind.
2. AIOps Uses Observability Data to Learn and Automate
Once observability data is in place, AIOps systems (like Moogsoft, Dynatrace, or ServiceNow AIOps) can:
- Detect incident patterns in logs
- Predict service degradations based on early telemetry
- Automate root cause analysis (RCA) using trace data
- Trigger remediation actions, like restarting a service or rerouting traffic
3. For Agentic or RAG Workflows, It’s Even More Critical
If your system includes:
- Multi-agent orchestration
- Tool-based planning (LangChain, CrewAI, etc.)
- Retrieval-Augmented Generation (RAG)
…then observability enables:
- Tracing agent decision chains
- Detecting bad retrieval or faulty reasoning
- Triggering feedback loops to re-route, retry, or alert
This ties directly into closed-loop automation, a core goal of AIOps.
4. Example Workflow: Observability + AIOps
Let’s say your RAG-based internal assistant stops returning accurate search results.
- Observability shows: retrieval score dropped below 0.5 and embedding drift increased
- AIOps sees this trend, correlates with increased user complaints and tool timeouts
- Automated action: rollback to previous embedding model + alert platform engineering
Summary
| Observability | AIOps |
|---|---|
| Collects raw signals | Learns from them and makes decisions |
| Answers “what happened?” | Answers “what to do about it?” |
| Passive insights | Active, automated response |
| Human-in-the-loop debugging | Machine-in-the-loop triage + action |
Final Thoughts
As AI agents become more complex and autonomous, observability becomes more than just good practice—it’s foundational. Enterprises deploying RAG pipelines or agent orchestration platforms must treat observability as part of the build, not the afterthought.
By tracing reasoning, debugging behavior, and tracking quality, observability ensures your AI systems are reliable, trustworthy, and ready for scale.


ITOpsAI Hub
A living library of AI insights, frameworks, and case studies curated to spotlight what’s working, what’s evolving, and how to lead through it.

What you’ll find in AI Blogs & Insights:
- Practical guides on AIOps, orchestration, and AI implementation
- Use case breakdowns, frameworks, and tool comparisons
- Deep dives on how AI impacts IT strategy and operations

What You'll Find in Resources:
- Curated reports, research, and strategic frameworks from top AI sources
- Execution guides on governance, infrastructure, and data strategy
- Trusted insights to help you scale AI with clarity and confidence
What You'll Find in Case Studies:
- Vetted examples of how companies are using AI to automate and scale
- Measurable outcomes from infrastructure, IT, and business transformation
- Strategic insights on execution, orchestration, and enterprise adoption